Two case studies for diagramming
June 15, 2023
This report is also available as a PDF.
Abstract
We make the case for better diagramming tools that exploit the regular, compositional structure of diagrams often used in computer science to allow the diagrammer to easily describe diagrams at a higher level of abstraction than existing drawing programs, and compute with them as first-class objects through natural APIs, without compromising on their aesthetic quality. The ability to programmatically produce pretty illustrations would greatly enrich programming environments and proof assistants. We motivate this vision with two case studies of diagram domains, for which we describe the beginnings of diagrammatic theories as well as our prototype implementations. We discuss what these case studies reveal about the theory and practice of general-purpose diagramming.
Introduction
Diagrams are ubiquitous in computer science. They are found in research papers, textbooks, software documentation & manuals, presentation slides (when well made), and a significant portion of the whiteboards in any computer science department. Most often, the object of study is not the diagrams themselves, but the structure or process they depict, such as the design of an algorithm or a network; the diagram is a transparent representation. This will be one characteristic of what images or drawings we define to be diagrams in the context of this report: those that directly or transparently represent something else. (We will leave our definition slightly informal for the purposes of this report.) The other characteristic we will use to distinguish diagrams from the broader categories of graphics and visualizations is that a diagram is schematic, comprised of a few simple components, with no attempts at realism or realistic levels of detail. As the term suggests, a diagram (whether explicitly or not) has a schema, a pattern with which other similar diagrams could be constructed to represent similar things. Diagrams are hence often compositional to some extent and structurally regular. Additionally, not only are diagrams constructed schematically, but also interpreted as such. We would not consider a binary tree drawn with a computer drawing program to be a different diagram from the same tree drawn by hand with slightly squigglier lines and slightly misaligned nodes. They are merely different renderings of the same diagram, following the same schema, so to speak.
Hydra diagrams
The work presented in this report will be motivated by a schema of diagrams found in the book Hydras & co. by Castéran et al. [3]. They represent hydras, which are tree-like objects that are the states of a combinatorial game between Hercules and the Hydra (introduced as an object of mathematical study in [7]). There is not much about these diagrams that is specific to hydras, so the theory and tools we will build can be easily applied to other tree-like contexts, but the Hydras book will provide a concrete example.
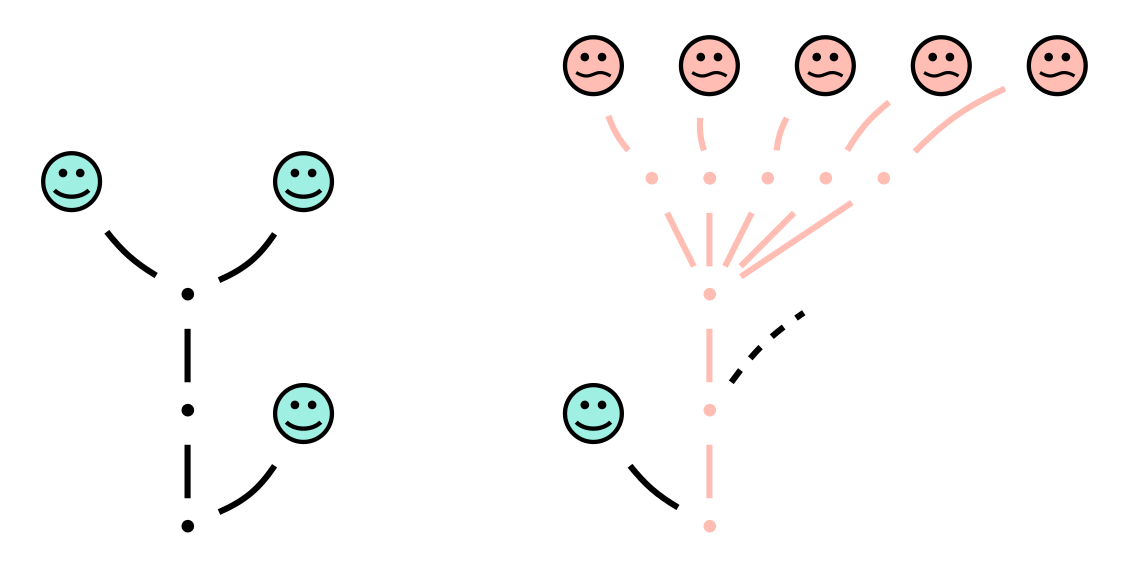
A hydra has a node, represented by a dot, and some children which are also hydras, represented by lines connecting the node to the children’s nodes. If a node has no children it is instead called a head and represented by an outlined circle (really a smiley face, but we can simplify). The fundamental operation in a hydra game is to cut off a head, which is easily depicted by a diagram like the one to the right in the diagram above.
We can turn this nice recursive structure of hydras into a parallel construct in a programming language to allow us to work with them programmatically. For instance, the authors of Hydras do the following in Gallina/Coq:
Inductive Hydra : Set :=
| node : Hydrae -> Hydra
with Hydrae : Set :=
| hnil : Hydrae
| hcons : Hydra -> Hydrae -> Hydrae
Here they have chosen to represent a node and its collection of children as separate types, and have the latter be implicitly ordered as a linked list. (Other representations could have been equally valid.) Thus the two diagrams from before represent the following two hydras:
(node
  (hcons (node
    (hcons (node
      (hcons (node hnil)
      (hcons (node hnil) hnil))) hnil))
  (hcons (node hnil) hnil)))

(node
  (hcons (node hnil)
  (hcons (node
    (hcons (node
      (hcons (node (hcons (node hnil) hnil))
      (hcons (node (hcons (node hnil) hnil))
      (hcons (node (hcons (node hnil) hnil))
      (hcons (node (hcons (node hnil) hnil))
      (hcons (node (hcons (node hnil) hnil))
      hnil))))))
    (hcons [just cut off] hnil))) hnil)))
Now, we can exploit this structure to write elegant functions to compute with hydras, for instance, to determine the height:
fix height (h : Hydra) : nat :=
  match h with
  | (node hs) => 1 + (heights hs)
with heights (h : Hydrae) : nat :=
  match h with
  | hnil => 0
  | (hcons hsub hsubs) =>
      max (height hsub) (heights hsubs)
Of course, we would also like to draw the diagrams programmatically, to achieve a uniform appearance and to be more conveniently able to make derivative diagrams (to ‘compute with’ diagrams). The diagrams in the book are drawn with TikZ, a standard programmatic drawing tool in the computer science community [9]. For instance, here is how the left diagram from before is drawn:
\node (N1) at (2,2) {$\bullet$};
\node (N2) at (2,4) {$\bullet$};
\node (N3) at (2,6) {$\bullet$};
\node (H1) at (0,8) {$\Smiley[1.5][vertfluo]$};
\node (H2) at (4,8) {$\Smiley[1.5][vertfluo]$};
\node (H5) at (4,4) {$\Smiley[1.5][vertfluo]$};
\draw (N1) -- (N2);
\draw (N2) -- (N3);
\draw (N3) to [bend left=10]  (H1);
\draw (N3) to [bend right=16] (H2);
\draw (N1) to [bend right=16] (H5);
What a stark contrast to the expression
with node, hcons, hnil! The TikZ source does
not seem to reflect the nice recursive structure of the hydra, nor does it seem
particularly conducive to computing as we had hoped. Then it’s not a surprise that
these diagrams become rarer as the book proceeds, essentially vanishing altogether
when it gets to complex proof scripts for which a diagrammatic aid to understanding
would have been most helpful. Drawing many hydra diagrams with TikZ is just as
tedious as drawing them by hand.
This report will ask and begin to answer the questions: what if simple
representations like (node (hcons (node hnil) hnil)) were sufficient to
generate corresponding and reasonably pretty diagrams? What if computing the
graphical size of a hydra diagram was just as elegant as computing the conceptual
height of the hydra? What if we could trivially change the styling to use nested
boxes instead while preserving the semantics and input language? Imagine a
formalization of hydras in a proof assistant like Coq where in addition to having a
textual Coq notation, the hydras in the goal state at each step of a proof were
illustrated automatically; or a programming language where in addition to defining a
string representation for debugger inspection, the hydra data type could just as
easily define a diagram representation…


Diagrams for programming and proving
Diagrams are ubiquitous in computer science as mentioned in the first paragraph of this report, but two places they are rarely seen in are programming environments and proof assistants. Why not? We conjecture that two innovations are missing. Firstly, we have not yet discovered the right language to describe diagrams and compute with them, i.e. define operations on diagrams that may or may not correspond to operations on the objects being represented. Languages like TikZ are too low-level and hence too powerful for easy, rapid prototyping in constrained domains; visualization libraries like d3.js [2] are designed for domains that often don’t have the compositionality or structural rigidity/regularity that the diagrams we are considering do. A good diagramming language should also make it easy to extend the schema of a diagram with new types of elements.
Secondly, programmatically generated diagrams are not pretty enough. Human criteria for diagram aesthetics are plenty and often unspoken: boxes must fit the text they contain; edge crossings in a graph must be minimized, within the layout constraints of the vertices themselves; spacing and lengths must reflect the abstract hierarchy of the objects being diagrammed; elements should either be perfectly aligned, or obviously unaligned, akin to ‘general configurations’ in geometry where lines are not drawn parallel unless specified as such; and so on. Even when made explicit, implementing these constraints requires significant effort and attention to detail, making it not worth it for most users and hence the responsibility of the library, which many libraries do not shoulder either. The problem becomes yet more difficult for ‘online’ diagramming, where the full object is not known in advance (perhaps it is being incrementally constructed by the user), but the diagram must avoid major layout changes as far as possible to provide the user with a stable visualization.
The broader vision that drives this project is to augment mainstream proof assistants and programming environments with tools for describing, computing with, and making pretty renderings of diagrams, that do not require too much time or effort from the user and that address the problems described above. A secondary benefit of such tools could be to automate—and maybe even improve—static diagrams in research papers, textbooks, slides, and the like.
Hydra diagramming prototypes
In this section, we will look at the implementations and results of two prototype tools for diagramming hydras. The first tries to produce tree diagrams similar to those found in the Hydras book, while the second tries an entirely different approach, using nested boxes to represent the hierarchy. Both are implemented in Racket and the source code is available on request. We will critically evaluate these prototypes later in § Discussion and future work.
Trees
Recall our definition of hydras and their tree diagrams
from § Hydra diagrams. We start with the observation that
tree diagrams for hydras are recursively compositional in much the same way that
hydras are themselves. A hydra node has zero or more children that are themselves
hydras, and a node in a tree diagram has zero or more children that are themselves
trees, except that we usually also want to connect the node to the nodes of the
children with lines that are not strictly part of either. For the moment, let’s
ignore the lines, and deal only with the dots and circles that represent hydra
nodes. We further observe that the children (Hydrae in the Coq
definition) also happen to have a recursive compositional structure as a linked list,
although the order is not semantically relevant. We can similarly define a hydrae
diagram that is not a tree but will become a tree when composed with a parent
node.
Thus:
the hydrae diagram of
hnilis an empty diagram;the hydrae diagram of
(hcons h hs)is the horizontal, bottom-aligned juxtaposition of the hydra diagram ofhand the hydrae diagram ofhs;
the hydra diagram of
(node hs)isan outlined circle when
hsis empty, elsethe vertical, center-aligned juxtaposition of a small dot and the hydrae diagram of
hs.
This is already beginning to suggest an API for our diagrams. The constructors are the empty diagram, an outlined circle, and a small dot; the operations are horizontal, bottom-aligned juxtaposition and vertical, center-aligned juxtaposition. While we’re at it, we may as well define the other juxtapositions, all six combinations of horizontal and vertical with left/top-aligned, center-aligned, and right/bottom-aligned. Lastly, we need an observer operation to draw a diagram, for instance as vector drawing instructions to be rendered into an SVG.
In fact, the aligned juxtaposition operations can be decomposed into simpler parts if we additionally keep track of the spans of diagrams. (These are already hinted at by the rectangular outlines for the diagrams above.) Then we can compute the offset required to align a diagram with another, say, centered horizontally, and pass this offset as a parameter when drawing the subdiagrams. The span of a juxtaposition is easy to compute from the spans of its parts while the spans of the constructors would have to be defined at the same time as their observers.
Now we consider the connecting lines in a hydra diagram. Finding one endpoint of each line is easy, because it is just the parent node of the diagram. The other endpoints will be the nodes of each child hydra within the hydrae diagram. The hydra diagram being constructed, in turn, should make its parent node available as an endpoint, should it be ever included in a larger diagram. This observation suggests some extensions to our diagram API:
the empty diagram exposes no endpoints, and the circle and dot expose one endpoint, namely their centers; and
the juxtaposition of two diagrams exposes some endpoints as a function of the endpoints of the two diagrams, in our case:
only the single endpoint of the bottom diagram for a hydra, and
the accumulation of all the endpoints for a hydrae diagram.
The roots are indicated with + below, before and after a vertical juxtaposition.

Thus the only action needed to construct a hydra diagram beyond the juxtaposition is to actually draw the lines between the internal endpoints as needed. Clearly, lines do not have the same API as above, but we leave the question of defining an API for lines for future work and treat them as ad-hoc objects for now.
Finally, as an aesthetic preference, we would like the lines to not extend right until the endpoints but end some distance away. We achieve this by pairing each endpoint with an anchor function that determines, for any given source endpoint, where a line coming from that source should ‘anchor’ in relation to the (destination) endpoint under consideration. (In general, we can imagine lines needing to anchor at different locations, to leave enough space for other components, or to avoid awkward angles, etc.)
It turns out that this is all we need to automatically draw reasonably pretty tree
diagrams for hydras! With less than 200 lines of Racket code, most of which could
arguably be part of a more general ‘diagramming library’ instead of a specific
hydra-diagrams library, we are able to turn expressions composed
of node, hcons, and hnil into pretty
diagrams.

Nested boxes
Next, we attempt an entirely different diagrammatic representation of hydras, albeit still with a recursive compositional structure, using nested boxes. We will produce diagrams where a box represents a node and its children are represented as nested boxes. A hydra head (a node with no children) is consequently represented by an empty box which we color red as a stylistic preference. For instance, the diagram below represents the same hydra as the diagram at the end of the previous section.

This diagram schema has many more degrees of freedom than the hydra trees we saw previously. Here, there are many different possible layouts of child boxes inside a parent box, even when we only consider layouts that completely fill the available space, e.g. all children in one horizontal line or three children in a π shape; and then many possible relative distributions of space among the children within any given layout; and we are still free to choose the size of the outermost box. Note that we ignore the semantically irrelevant ordering of children present in the linked-list-like hydrae definition as nested boxes have no obvious order.
This freedom will require more careful treatment than tree diagrams to produce pretty output. We will start by noticing that the layout and relative sizing of a box and its direct children can be neatly described by defining a grid in terms of relative proportions of the rows and columns and defining the location and span of each child in grid coordinates. (An example is shown below.) Then, we will consider transpositions of grids, to make better use of available space depending on the aspect ratio. Finally, we will state some informal aesthetic properties we want for our hydra box diagrams, and use them to guide our implementation in terms of grid layouts.
A grid is defined by four parameters: the relative proportions of the rows, the relative proportions of the columns, the absolute gap between elements, and the absolute padding between the edges of the layout and its elements. (The row proportions are independent of the column proportions since the eventual total height of the layout is independent of the width. Also, we make the simplifying, aesthetically-motivated assumption that the horizontal and vertical gap is the same, but removing this assumption from the implementation is trivial. Similarly, we can assume the padding to be the same as the gap unless specified.) With these parameters, given any width and height, we can compute the start (green) and end (blue) x and y coördinates for every grid cell, as shown in the figure below.
(define gl
  (new grid-layout-with-lines% [...]
               ; columns  rows
    [grid-defn '((1 2 1)  (3 1))]
    [gap 16] [padding 10]))

(send gl draw! 400 150)
(send gl draw! 200 200)
A grid layout of a collection of elements consists of the grid definition along with the position of each element in the grid as a starting row and column and the number of rows and columns spanned.
(define gl [...]
  ; start row, start col, row span, col span
  [item-defns (list (list 0 1 1 2 box))]
  [...])

(send gl draw! 400 150)
To transpose a grid layout is to simply treat rows as columns and vice versa. We do not change the meaning of x and y or width and height, and we do not rotate or flip any elements, and we do not ask the elements to change how they draw themselves in any way. Transposing twice returns the same grid layout.
(send (send gl transpose) draw! 400 150)An autotransposing grid layout is a grid layout that decides every time it is drawn whether to draw itself directly or to draw its transposition, based on the width, height, and grid and element parameters. The decision predicate can be arbitrary. For the purposes of this section, we only use one simple predicate, which aligns the more numerous grid dimension (rows or columns) with the larger length (width or height), ignoring the proportions and contents of the grid.
Now, we wish to implement nested box diagrams for hydras in terms of grid layouts. If a hydra node is drawn as a grid layout, a natural choice would be to have each subhydra also be a grid layout, as an element in the parent layout, and finally the hydra heads would be grid layouts with no elements. Beyond this structure, we can informally describe the following ways in which we would like our diagrams to be pretty, and how we can achieve each of them:
Roughly equal head sizeHeads should be roughly the same absolute size regardless of what total height and width the diagram is drawn at. But we cannot control the size of the heads directly, so we take a different approach, assigning a weight to every (sub)diagram. A head has weight equal to wh; a non-head node has weight equal to the sum of the weights of its children, plus wn. At every level of the diagram, we distribute the available space among the siblings in proportion to their weights. Then we intuitively expect heads to have roughly the same absolute size because they all have weight wh and the space taken up by gaps and padding in intermediate nodes is compensated by wn.
Roughly square boxesBoxes should not be too long or too wide. Again, we cannot control the sizes of boxes directly, but we can use autotransposing layouts at every level of the diagram. We further note that for large aspect ratios, a linear layout (i.e. only one row or column) makes its elements more ‘square’ than any layout further divided on the shorter axis. So each diagram actually maintains two layouts, one linear and one potentially more complex, and chooses between them based on the aspect ratio every time the diagram is drawn with a specific width and height, whereupon the chosen layout further decides whether or not to transpose itself as usual.
Simple gridsGrids should not be too complex. (This is the most informal and underspecified of our aesthetic preferences.) When a grid layout has more than a handful of elements, the number of ways to lay them out grows very quickly, and this has tricky interactions with our decision to distribute space according to weight. Thus we use the following algorithm to determine the layout while keeping it visually relatively simple. Let h be the number of ‘heavy’ elements that have more than a quarter of the total weight w of the diagram. (w1, w2, etc. will denote their weights.) Match on h:
If 0, use a linear layout.
If 1, split the available space in two as w1 : (w − w1). Allocate the first part to the heavy element. Allocate the second part to the rest of the elements, laid out recursively with this algorithm with total weight adjusted accordingly, except without a visible boundary or padding.
If 2, split the available space in two as w1 : (w − w1), and split the second part in two as w2 : (w − w1 − w2). Allocate the first and second parts to the heaviest and second-heaviest elements. For the third part, recurse as above.
If 3, split the available space in two as w1 : w2, and split both parts in two as w1 : w3. Allocate the heaviest, second-heaviest, and third-heaviest elements as indicated by the ratios of the areas. For the fourth part, recurse as above. Empirically, this gives good results.


This concludes our implementation. Again, in around 200 lines of Racket code, much
of which we could argue is a more general-purpose library for grid layouts, we are
able to turn expressions like ((()())(()(())((())))) (the slight
difference in input language is a trivial matter of syntax) into diagrams like the
following, for any width and height.

Discussion and future work
The first question we ask of our hydra diagramming prototypes is, how do they generalize to our broader vision for diagramming tools? We argue that many of the key ideas and implementation strategies form the beginnings of a general theory of and library for diagrams. First, we introduced the notion of a schema of diagrams, that we started to be able to specify at a level of abstraction higher than specifying the renderings of individual diagrams in it. Second, we began investigating some algebraic properties of tree diagrams that are likely common to many other schemas, including aligned juxtapositions and the consequent implementation choices with spans, the separation between the algebraic object and its rendering (where the latter may take more parameters), and the endpoints and anchor functions associated with a diagram. Third, we were able to produce an elegant implementation of grid layouts that can additionally be transposed and nested. Fourth, we investigated how common but informal and hard-to-pinpoint aesthetic preferences for grid layouts can be reasonably achieved by simple extensions to the basic library.
Nevertheless, important challenges remain. One is the applicability of these techniques to diagram domains with less or no hierarchical structure. Primitive constructors likely play a much bigger part in such domains than combinators; how do we make them easy to define and use, while also playing well with combinators when required? How do we make it easy to extend a highly structured domain with components that break the pattern?
Another challenge is the treatment of connectors like lines and arrows which we have discharged ad hoc for tree diagrams. How do connectors fit into our philosophy of exploiting the regularity and compositionality of diagrams? We point out that even in our existing implementation, merely knowing the endpoints exposed by two elements was not enough to draw a connector between them, because we wanted the connector to anchor some distance away. In general, connectors can behave specially at the ends, such as with arrowheads or adapting to the shape of the diagram being connected; they can change the span of a diagram and influence its layout with respect to others if we care about overlaps or crossings; they can curve and align or intersect with each other, and it is difficult to pinpoint what makes their layout intuitively pretty or not. Connectors must also be able to cross the hierarchy and connect elements at different levels, which suggests that beyond just exposing a name for endpoints, diagrams should expose paths to endpoints contained within them. It remains to be seen how we can make it natural for a user to specify connectors in a diagram schema without concerning themselves with low-level layout.
So far, we have not considered the question of ‘packing’, i.e. keeping track of
the spans of diagrammatic elements with more fidelity than just a rectangle. This can
be important for offline layout where frugality of space usage is desirable, as
opposed to online layout (when the entire diagram is not known in advance) where we
would instead leave empty space in case it is needed later. For instance, packing is
one of the primary motivations behind the forest package for
TikZ [10], and indeed, it is a key difference between the
tree diagrams we produce and those from the Hydras book. This notion is also
relevant when laying out text as part of a diagram because we often want to fit or
minimally resize elements around text or play with the tradeoff between length and
width.

From the first page of forest’s documentation.
A more practical challenge that remains is the plumbing to connect our current and future diagramming tools with proof assistants and programming environments. For a tactic-oriented proof assistant like Coq, an essential feature would be to show the diagrams directly as or as part of the goal state in the user interface. A less essential but nonetheless very desirable feature would be to enable the user to describe diagrams from within the proof assistant, like textual notations in Coq, and tweak the drawing procedures in its native programming language. On the other hand, diagramming in regular programming environments will likely have a different workflow that we have yet to investigate.
We believe that the most promising way forward for this project is to build
similar tools for more diagram domains, develop them to the point where they can
smoothly produce pretty diagrams for a wide range of examples, and only then start to
attempt to generalize them into a more general-purpose diagramming library. Domains
we are interested in exploring in the near future include string diagrams, used, for
instance, for quantum circuits [4], linear algebra [8], and Boolean logic [5], among others; linked data structure
visualizations such as for linked lists, trees, and ‘environment diagrams’ used to
teach introductory programming [6]; and diagrams for visualizing concurrent program
behavior and memory models, such as those produced by herd71 [1].
References
- Jade Alglave, Luc Maranget, and Michael Tautschnig. 2014. Herding Cats: Modelling, Simulation, Testing, and Data Mining for Weak Memory. ACM Transactions on Programming Languages and Systems 36, 2 (July 2014), 7:1–7:74. dl.acm.org/doi/10.1145/2627752
- Mike Bostock. 2021. D3.Js. d3js.org/
- Pierre Castéran, Jérémy Damour, Karl Palmskog, Clément Pit-Claudel, and Théo Zimmermann. 2022. Hydras & Co.: Formalized mathematics in Coq for inspiration and entertainment. In Journées Francophones des Langages Applicatifs: JFLA 2022. hal.science/hal-03404668
- Bob Coecke and Ross Duncan. 2011. Interacting quantum observables: Categorical algebra and diagrammatics. New Journal of Physics 13, 4 (April 2011), 043016. doi.org/
10.1088/ 1367-2630/ 13/4/043016 - Tao Gu, Robin Piedeleu, and Fabio Zanasi. 2023. A Complete Diagrammatic Calculus for Boolean Satisfiability. Electronic Notes in Theoretical Informatics and Computer Science Volume 1 - Proceedings of MFPS XXXVIII, (February 2023). entics.episciences.org/
10481 - Philip J. Guo. 2013. Online python tutor: Embeddable web-based program visualization for cs education. In Proceeding of the 44th ACM technical symposium on Computer science education (SIGCSE ’13), Association for Computing Machinery, New York, NY, USA, 579–584. dl.acm.org/
doi/ 10.1145/ 2445196.2445368 - Laurie Kirby and Jeff Paris. 1982. Accessible Independence Results for Peano Arithmetic. Bulletin of the London Mathematical Society 14, 4 (July 1982), 285–293. doi.wiley.com/
10.1112/ blms/ 14.4.285 - João Paixão, Lucas Rufino, and Paweł Sobociński. 2022. High-level axioms for graphical linear algebra. Science of Computer Programming 218, (June 2022), 102791.sciencedirect.com/
science/ article/ pii/ S0167642322000247 - Till Tantau. 2023. The TikZ and PGF Packages. ctan.org/pkg/pgf
- Sašo Živanović. 2017. The forest package for LaTeX/TikZ/PGF. ctan.org/pkg/forest